This post looks at the seventh of the visualisation types created for the meSch museum post-visit website: the Map Visualisation. Click here if you are looking for an overview of the meSch museum post-visit website.
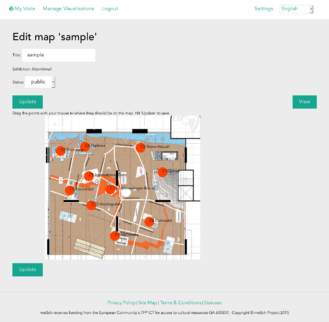
This map is a combination of static and dynamic content. The background layer is uploaded and configured by the curator. The curator must upload a background map image and drag the points of interest to the appropriate locations on the map. Once the curator is happy with their basic map they can flag the visualisation as “public”.
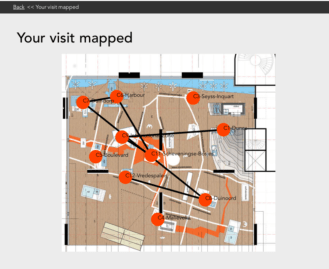
Once public this visualisation becomes available to regular users. When a regular user views this visualisation for an exhibition they have visited they will see the curators background map, with the path they have taken overlayed on top, with lines linking the points they visited in the order they were visited.

Curator view of Atlantikwall map. Each orange disc represents a point of interest. The Curator can drag the discs to the correct positions using their mouse and save the layout when happy.
Both the edit and view pages for this implementation rely on the JavaScript library d3.js. Code for this is available on bitbucket here, here and here.
