This is the third of a series of posts looking at each of the different visualization types created for the MeSch museum post-visit visualization tool. Click here for the overview.
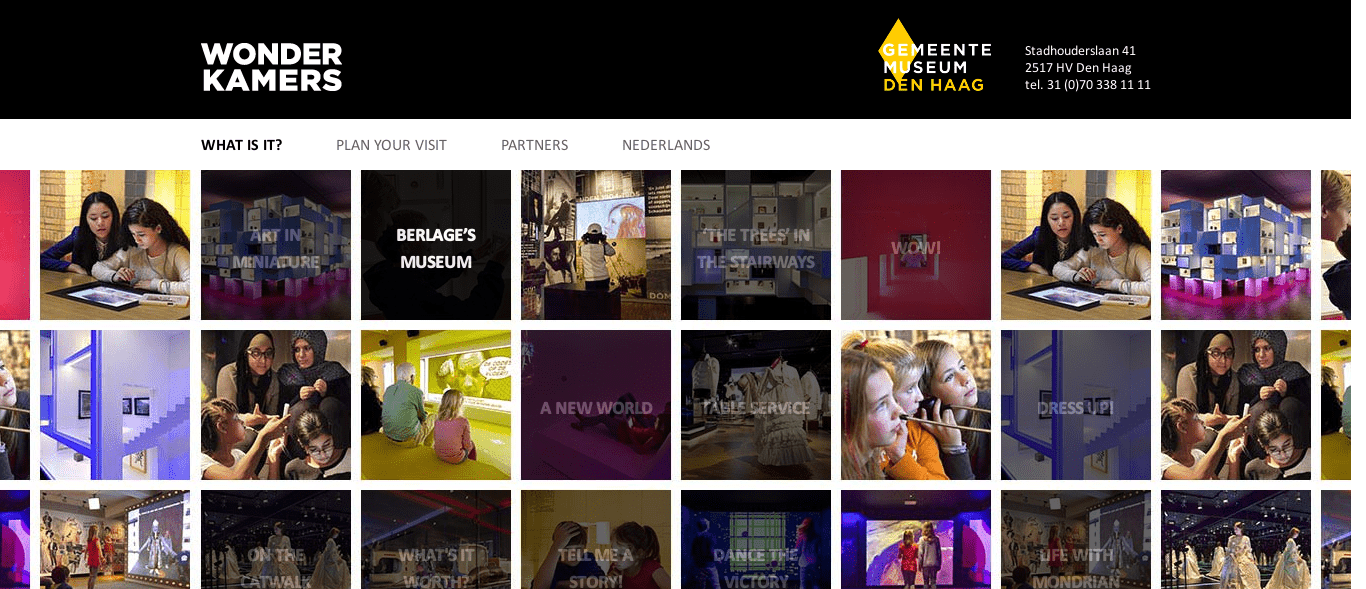
This experimental visualisation was inspired by a page on the Wonderkamers website (which has since been moved to the Kunst museum and updated)
 Not to be sidetracked but The Wonderkamers exhibition at Gemeente Museum in The Hague is an absolutely fantastic interactive museum experience that I was lucky enough to get to visit while working on the meSch project. They use the latest technology to bring fine art, decorative art, architecture and fashion to life through a computer game that places each visitor at centre stage.
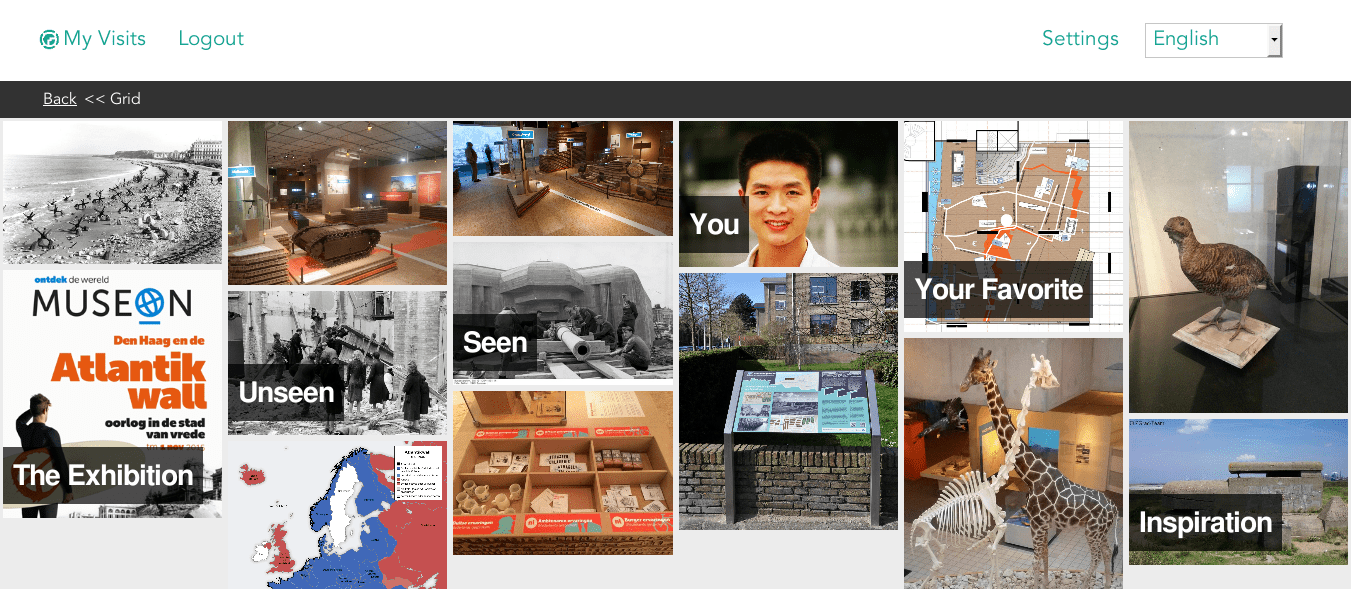
Anyway, the grid visualisation is a series of images in a grid that provide a gateway to additional information to the user. It is up to the curator to customise the visualisation by choosing at least 14 images to represent the exhibition. These images are laid out on a responsive grid across the page with a maximum of 6 columns.
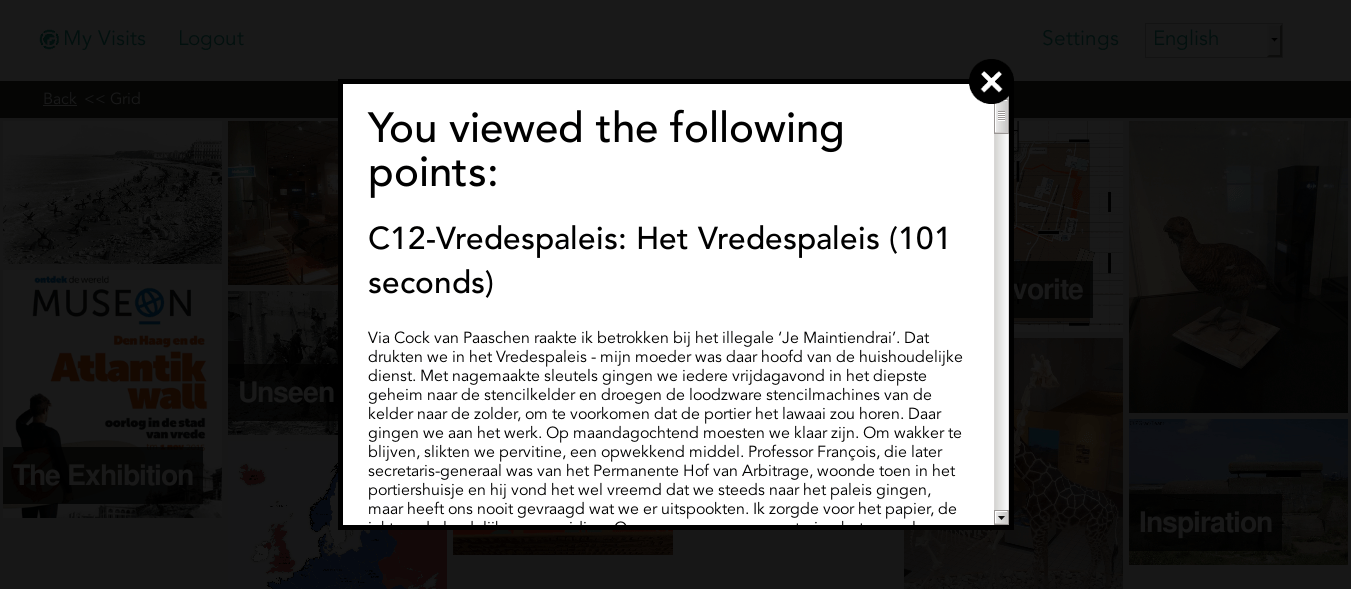
 Some of the image boxes are interactive. Clicking on any image with text will cause an overlay pop-up to appear containing additional information.
 The information displayed depends on what image text box is clicked.
- The Exhibition – will display a pop-up with a summary of the exhibition, an image and the URL of the exhibition website if this has been made available in the museum model.
- Unseen – will display the titles and content for any points of interest the visitor missed on their physical visit.
- Seen – will allow the site visitor to refresh their memory on the points of interest they interacted with during their physical visit.
- You – in theory, this could be an image of the visitor taken at the exhibition (assuming this facility was available on site) or it could be a unique personalised character designed to represent the user such as that covered here.
- Your favourite – This would provide additional information on the item the visitor spent the most time interacting with during their physical visit.
- Inspiration – This would make suggestions on additional items in other exhibitions the user could visit based on the items the user showed interest in during their visit.
This visualisation relies on the jQuery plugin colorbox. Code for this visualisation is available on bitbucket here.