If you’ve used Kibana, then you probably know how easy it is to create a dashboard via the GUI. What you may not know is that it is also possible to dynamically create kibana dashboards and visualizations! It is as easy as making a curl request.
Create a visualization
You simply need to make a curl call to your Elasticsearch server specifying the name of the visualization you are creating (with no spaces)
localhost:9200/.kibana/visualization/<VisualizationName-NoSpaces>
and pass it the visualization in json format
{“title”:”<title with no spaces>“,”visState”:”{\”aggs\”:[{\”id\”:\”1\”,\”params\”:{},\”schema\”:\”metric\”,\”type\”:\”count\”},{\”id\”:\”2\”,\”params\”:{\”field\”:\”<field to count on – case sensitive>\”,\”order\”:\”desc\”,\”orderBy\”:\”1\”,\”size\”:<number of pie segments>},\”schema\”:\”segment\”,\”type\”:\”terms\”}],\”listeners\”:{},\”params\”:{\”addLegend\”:true,\”addTooltip\”:true,\”isDonut\”:false,\”shareYAxis\”:true},\”type\”:\”pie\”}”,”uiStateJSON”: “{}”,”description”: “”,”version”: 1,”kibanaSavedObjectMeta”: {“searchSourceJSON”: “{\”index\”:\”<your index>\”,\”query\”:{\”query_string\”:{\”analyze_wildcard\”:true,\”query\”:\”<your query>\”}},\”filter\”:[]}”}}
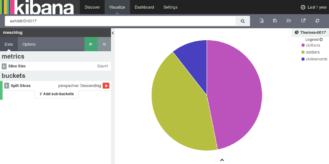
For example the following curl request entered via *nix command line will generate a pie chart with 3 segments (Assuming you have an index called “meschlog” with a field called “perspective” )
curl -XPUT ‘localhost:9200/.kibana/visualization/Themes-0017’ \
-d ‘{“title”:”Themes-0017″,”visState”:”{\”aggs\”:[{\”id\”:\”1\”,\”params\”:{},\”schema\”:\”metric\”,\”type\”:\”count\”},{\”id\”:\”2\”,\”params\”:{\”field\”:\”perspective\”,\”order\”:\”desc\”,\”orderBy\”:\”1\”,\”size\”:3},\”schema\”:\”segment\”,\”type\”:\”terms\”}],\”listeners\”:{},\”params\”:{\”addLegend\”:true,\”addTooltip\”:true,\”isDonut\”:false,\”shareYAxis\”:true},\”type\”:\”pie\”}”,”uiStateJSON”: “{}”,”description”: “”,”version”: 1,”kibanaSavedObjectMeta”: {“searchSourceJSON”: “{\”index\”:\”meschlog\”,\”query\”:{\”query_string\”:{\”analyze_wildcard\”:true,\”query\”:\”exhibitID:0017\”}},\”filter\”:[]}”}}’
Which should give you something like the visualization below

Extra tip: If you ever want to get the JSON from an existing visualization you simply need to navigate to the visualization on Elasticsearch.
http://localhost:9200/.kibana/visualization/<name of existing visualization>
e.g. http://localhost:9200/.kibana/visualization/CountSessions
Create a dashboard
Creating a dashboard is very similar. Again you are sending a curl command to your Elasticsearch server, this time to “dashboard” specifying the name of the dashboard you are about to create.
http://localhost:9200/.kibana/dashboard/
and pass it the JSON for the dashboard, listing all of the visualizations you want to add to it.
{“title”:”<DashboardName>“,”hits”:0,”description”:””,”panelsJSON”:”[{\”id\”:\”<VisualisationName1>\”,\”type\”:\”visualization\”,\”panelIndex\”:1,\”size_x\”:3,\”size_y\”:2,\”col\”:1,\”row\”:1},{\”id\”:\”<VisualizationName2>\”,\”type\”:\”visualization\”,\”panelIndex\”:2,\”size_x\”:3,\”size_y\”:2,\”col\”:4,\”row\”:1},{\”id\”:\”<VisualizationName3>\”,\”type\”:\”visualization\”,\”panelIndex\”:3,\”size_x\”:3,\”size_y\”:2,\”col\”:7,\”row\”:1},{\”id\”:\”<VisualizationName4>\”,\”type\”:\”visualization\”,\”panelIndex\”:4,\”size_x\”:3,\”size_y\”:2,\”col\”:10,\”row\”:1}]”,”optionsJSON”:”{\”darkTheme\”:false}”,”uiStateJSON”:”{}”,”version”:1,”timeRestore”:false,”kibanaSavedObjectMeta”:{“searchSourceJSON”:”{\”filter\”:[{\”query\”:{\”query_string\”:{\”query\”:\”*\”,\”analyze_wildcard\”:true}}}]}”}}
You may need to play around with position and size values for fields “size_x”, “size_y”, “col” and “row” in order to determine the size and positions of the visualizations on your dashboard.
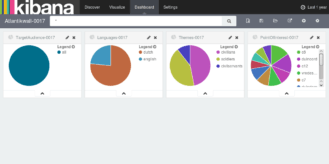
As an example, the following curl command entered on *nix command line would create a dashboard linked to the 4 visualizations listed. This does require you have the visualization names before you make the call to create the dashboard.
curl -XPUT ‘http://localhost:9200/.kibana/dashboard/Atlantikwall-0017’ \
-d ‘{“title”:”Atlantikwall-0017″,”hits”:0,”description”:””,”panelsJSON”:”[{\”id\”:\”TargetAudience-0017\”,\”type\”:\”visualization\”,\”panelIndex\”:1,\”size_x\”:3,\”size_y\”:2,\”col\”:1,\”row\”:1},{\”id\”:\”Languages-0017\”,\”type\”:\”visualization\”,\”panelIndex\”:2,\”size_x\”:3,\”size_y\”:2,\”col\”:4,\”row\”:1},{\”id\”:\”Themes-0017\”,\”type\”:\”visualization\”,\”panelIndex\”:3,\”size_x\”:3,\”size_y\”:2,\”col\”:7,\”row\”:1},{\”id\”:\”PointOfInterest-0017\”,\”type\”:\”visualization\”,\”panelIndex\”:4,\”size_x\”:3,\”size_y\”:2,\”col\”:10,\”row\”:1}]”,”optionsJSON”:”{\”darkTheme\”:false}”,”uiStateJSON”:”{}”,”version”:1,”timeRestore”:false,”kibanaSavedObjectMeta”:{“searchSourceJSON”:”{\”filter\”:[{\”query\”:{\”query_string\”:{\”query\”:\”*\”,\”analyze_wildcard\”:true}}}]}”}}’
This would result in the following dashboard
To read more about my adventures in data visualisations go here

