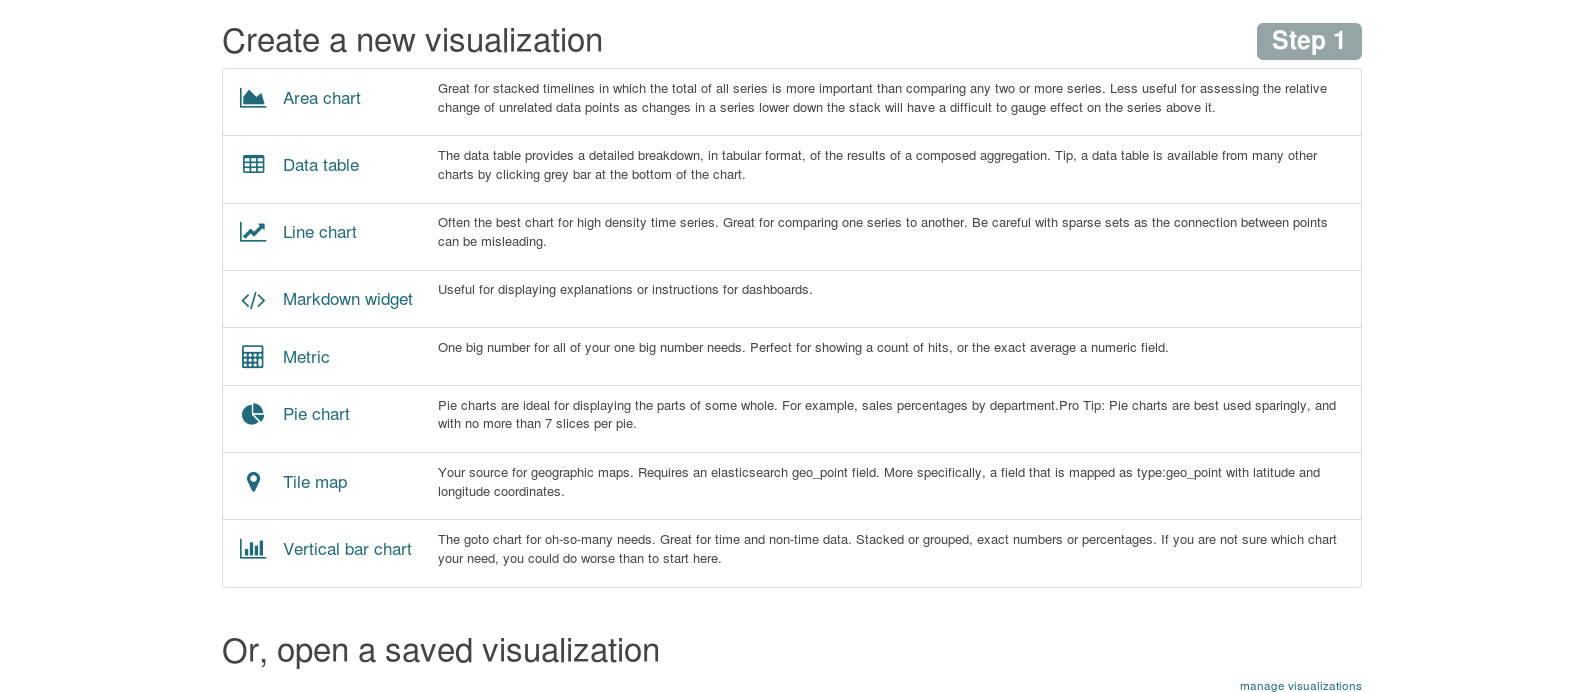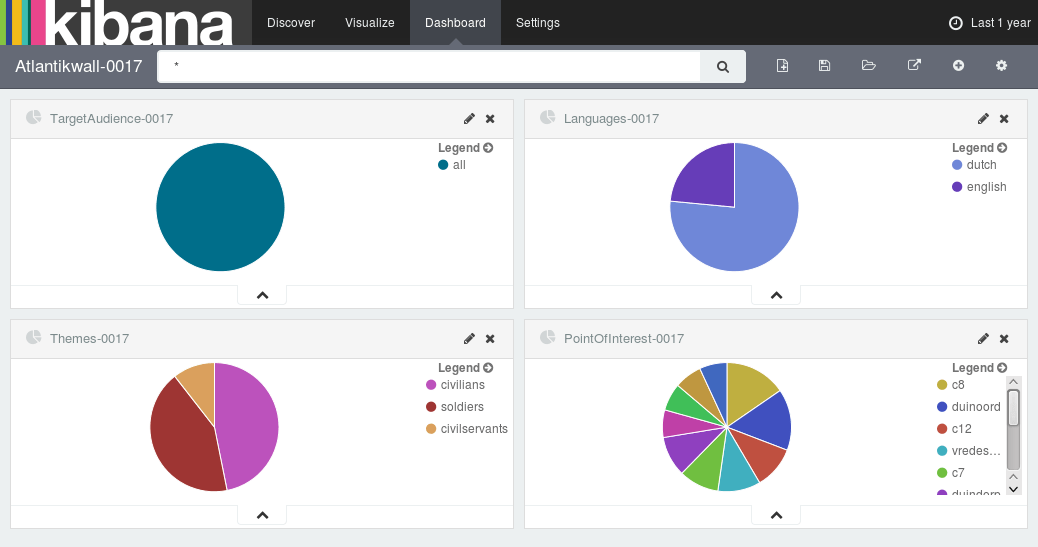
Create Kibana visualizations and dashboards dynamically
If you've used Kibana, then you probably know how easy it is to create a dashboard via the GUI. What you may not know is that it is also possible to dynamically create kibana dashboards and visualizations! It is as easy as making a curl request.