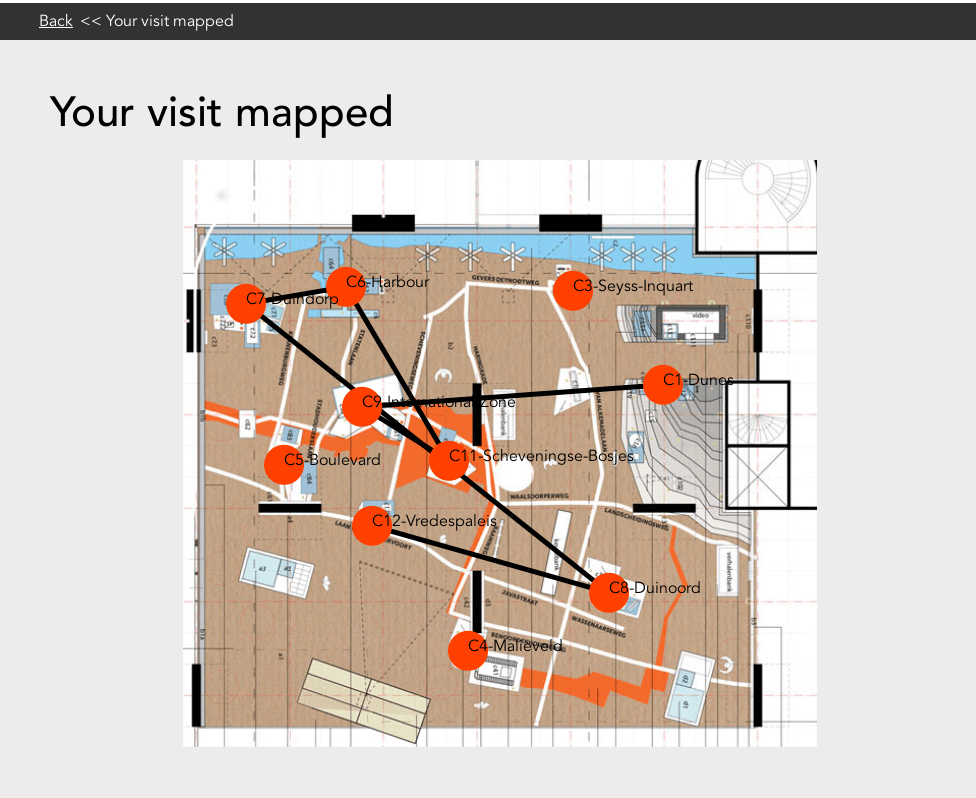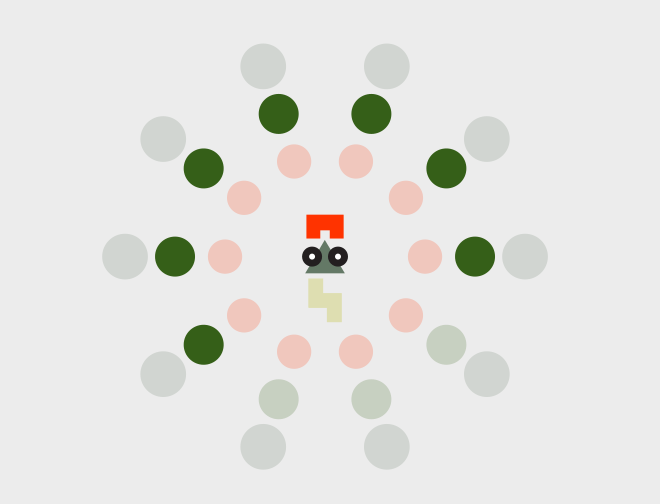
Animal Path Visualisation
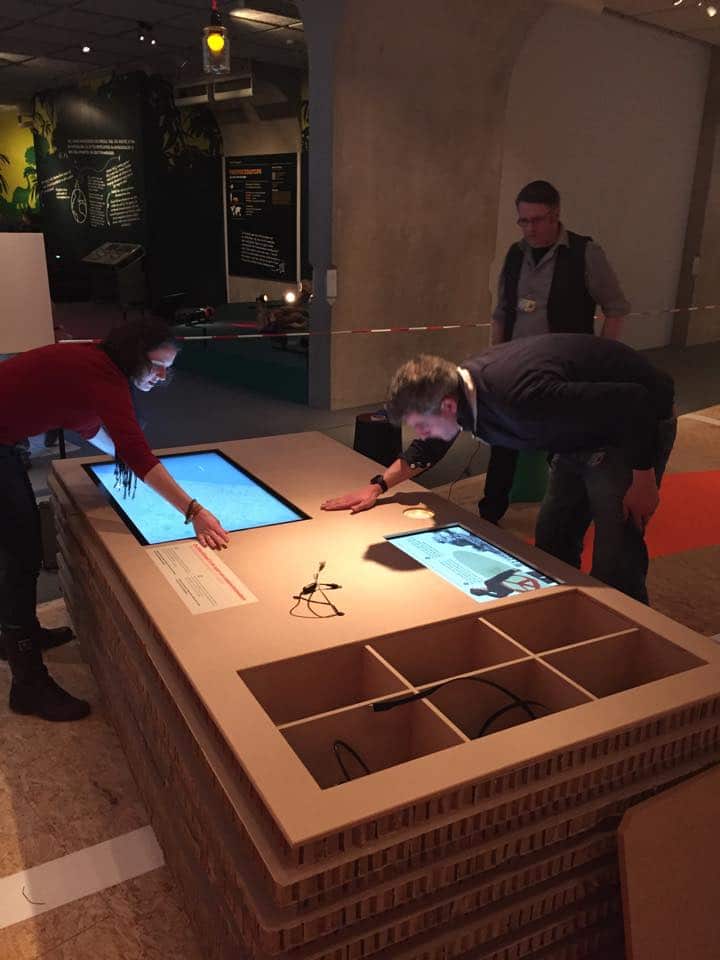
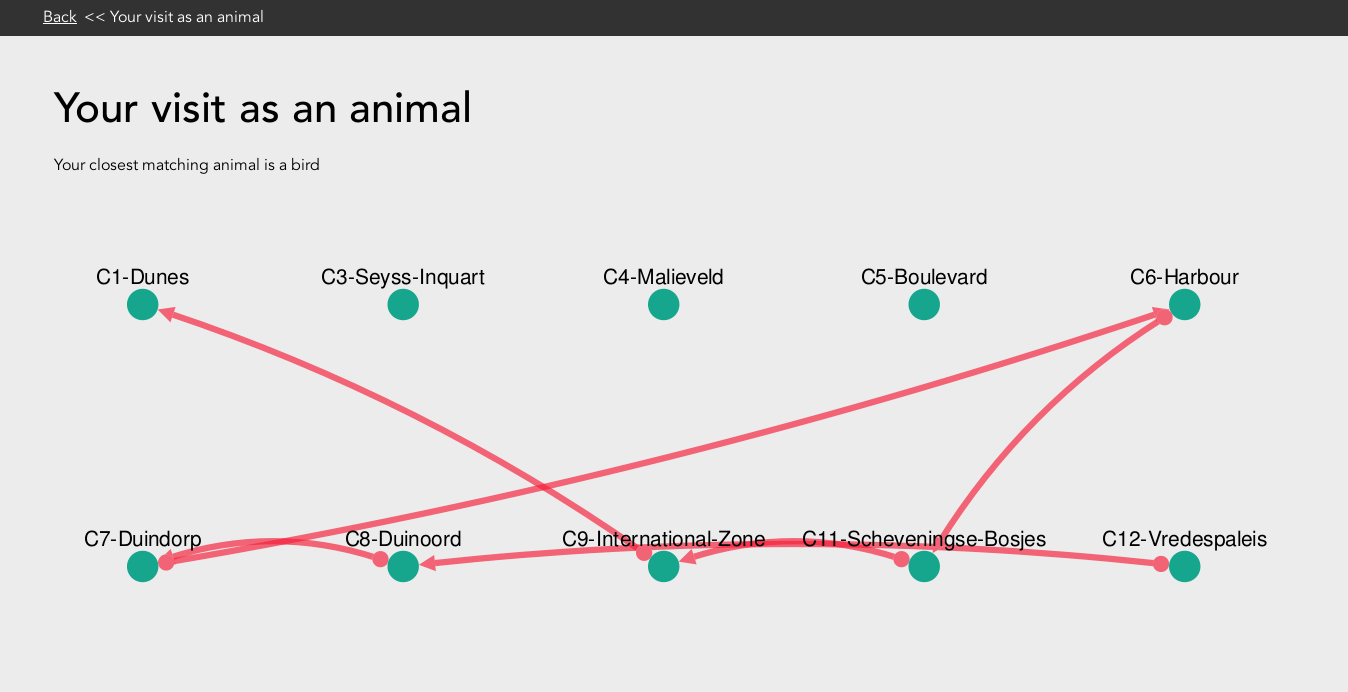
This post looks at the eighth of the visualization types created for the MeSch museum post-visit visualization tool. Click here for overview. This visualisation is loosely based around a French paper; Veron, E., Levasseur, M.: Ethnographie de l’exposition, Paris, Bibliothèque Publique d’Information, Centre Georges Pompidou. This Ethnographic study proposed that visitors movements in a museum could be compared to the behaviour of four "typical" animals. They used observational techniques to classify visitors as ANT, FISH, BUTTERFLY or GRASSHOPPER. For meSch we wanted to experiment with this idea and consider how such roles could be assigned to visitors using computational methods applied to the visitors log.